Calculation models
In the Research and Development Division, research has been carried out on the strength of containership hull subject to torsional loads. Two calculation methods have been analyzed: a method developed in Polski Rejestr Statków based on full-length model of hull and the method conforming to the requirements of Common Structural Rules for bulk carriers and oil tankers, based on three cargo hold model (so called “cargo-hold analysis”).
A mesh of finite elements of the analyzed ship, which has been the basis for models conforming to requirements of both methods, is presented below.
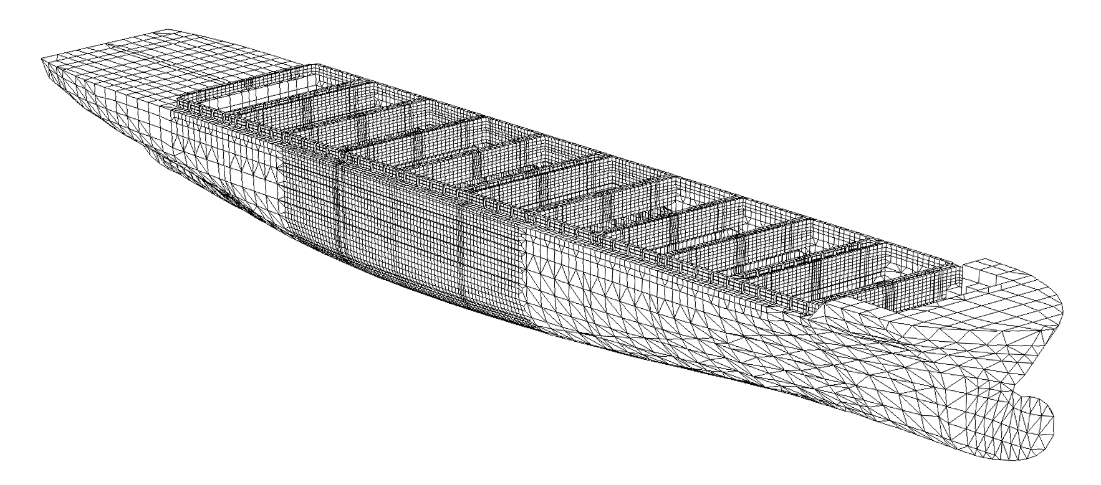
Fig. 1 A mesh of finite elements for a containership
The first of models, conforming to the method developed in the Research and Development Department, is a full-length model where the mesh of finite elements is divided into two regions. In the region of three holds in the midship area, the FE mesh is constructed of plate panels the size of which is equal to the distance between stiffeners, while in the aft and fore parts of hull the element size is equal to the distance between primary supporting members. Additionally, in the midship area, the plating stiffeners are modelled as beam elements. The torsional load is executed by means of constant continuous loads applied to model sides. The model is shown in the below figure.
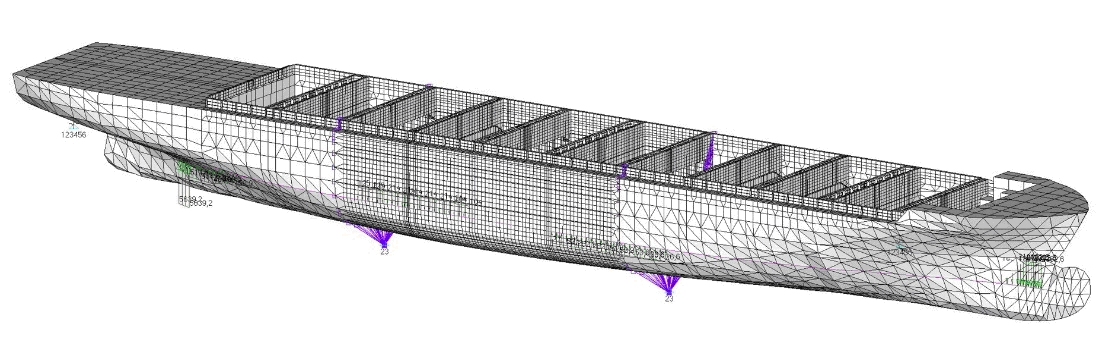
Fig. 2 Model A, based on the PRS developed method
The second model, created based on CSR, is restricted lengthwise to three-hold module in the midship area (the fragment with more dense mesh visible in figure 3). The finite elements mesh is built of plate panels the size of which is equal to the distance between stiffeners and of beam elements representing stiffenings. Stiffness of extreme parts of hull is simulated by so called ‘end-constraint beams’. The model has been loaded with concentrated torsional moment.
Calculation results
The form of deformation of both models, as shown in figures 3 and 4, is consistent with preliminary predictions and reflects the nature of applied torsional load. In both cases, warping effect in model sections is clearly visible, however, it is far more significant in model B.
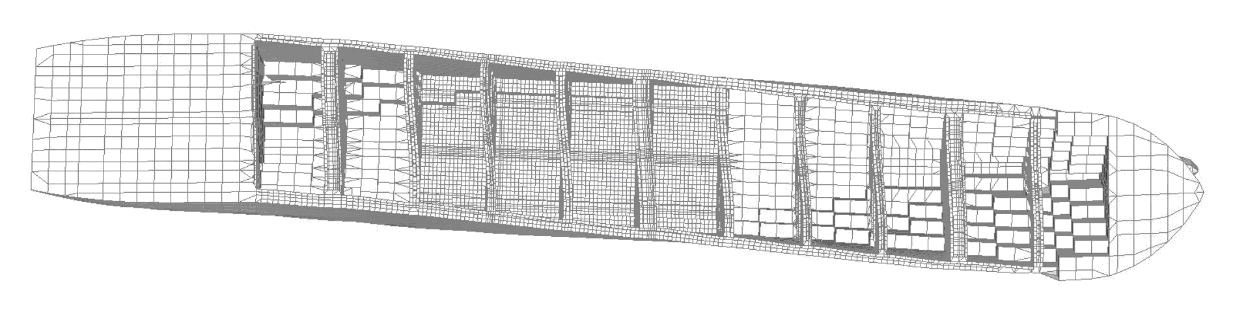
Fig. 3 Deformation of model A
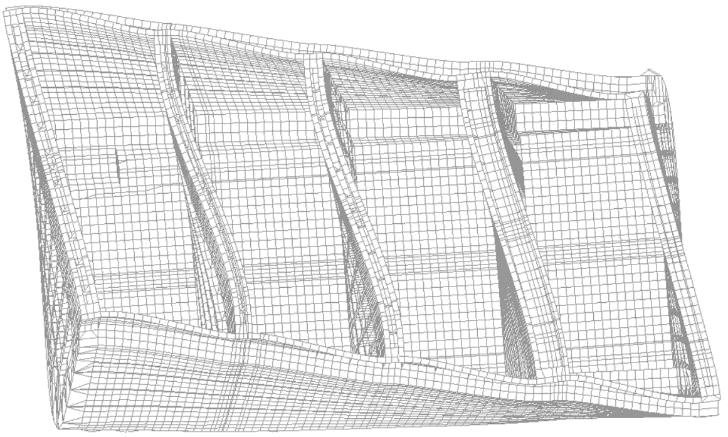
Fig. 4 Deformation of model B
Loads distribution in both models is similar and concentrates in master nodes, such as hatch corners and deck plating in way of cross-deck structure. Considerable differences occur among stress values, which are highly underestimated in model B.
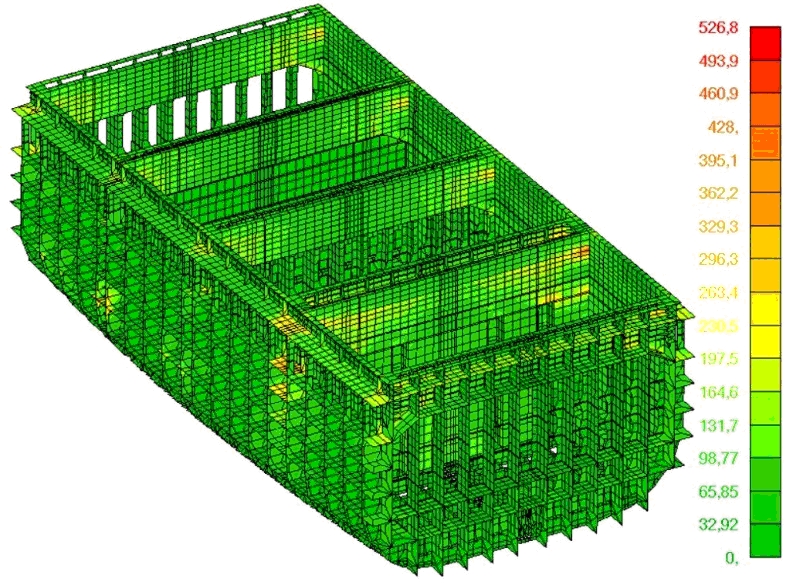
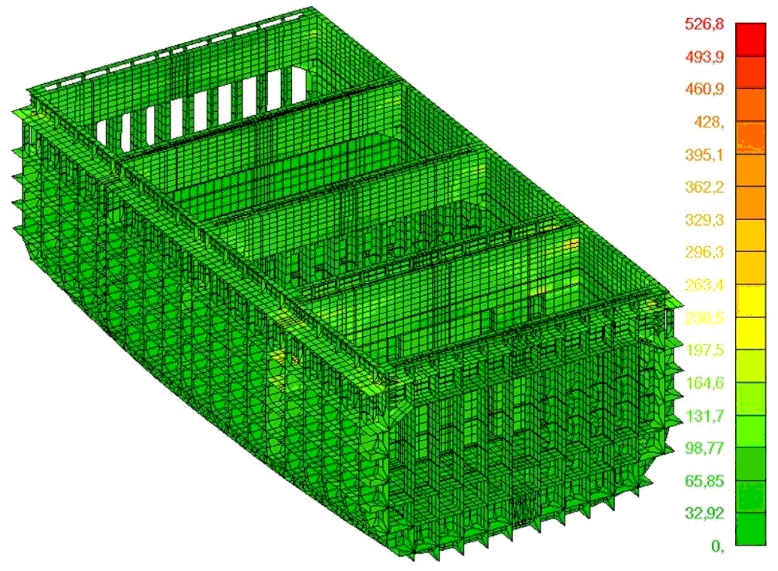
Fig. 5 Equivalent stresses in models A and B, [MPa]
In order to compare both models, maximum stresses in master nodes of strength deck have been combined. Their position is shown in the figure below. Results are given in the below table.
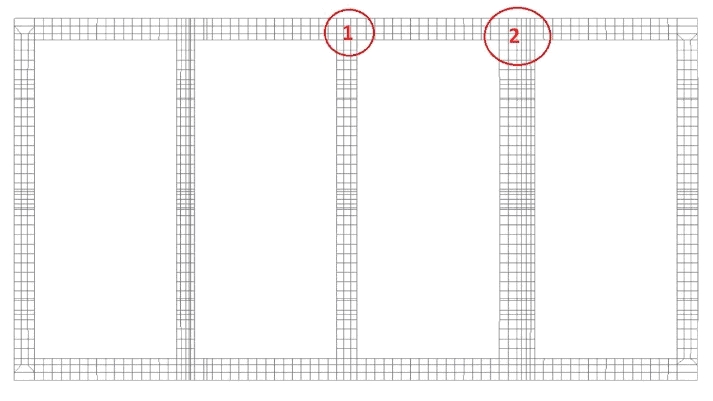
Fig. 6 Position of selected elements
Tab. 1 Maximum stresses in selected deck elements
|
Region |
Stresses [MPa] |
Model A |
Model B |
Δ [%] |
|
1 |
Normal |
60.0 |
44.2 |
26 |
|
Shear |
120.2 |
79.7 |
34 |
|
|
Equivalent |
208.3 |
138.2 |
34 |
|
|
2 |
Normal |
117.1 |
93.2 |
20 |
|
Shear |
166.6 |
104.7 |
37 |
|
|
Equivalent |
298.7 |
209.3 |
30 |
Performed research proved that the ‘cargo-hold analysis’ approach used in hull strength analysis of bulk carriers and oil tankers does not reflect real response of containership hull structure subject to torsional loads. However, with considerable workload at model execution, the developed in Polski Rejestr Statków full-length analysis method provides reliable and true values of stresses and deformations of containership hull in torsion.
Presentation
Extended version of the above analysis has been presented during MARTECH 2020 conference, held on 16-19 November in Lisbon, Portugal, and will be available in published post-conference papers.